Series.hist
- Series.hist(by=None, ax=None, grid=True, xlabelsize=None, xrot=None, ylabelsize=None, yrot=None, figsize=None, bins=10, **kwds)
Draw histogram of the input series using matplotlib.
See :pandas_api_docs:`pandas.Series.hist` for usage.
Notes
Derived from
pandas.plotting._core.hist_frame 0.25.3Examples
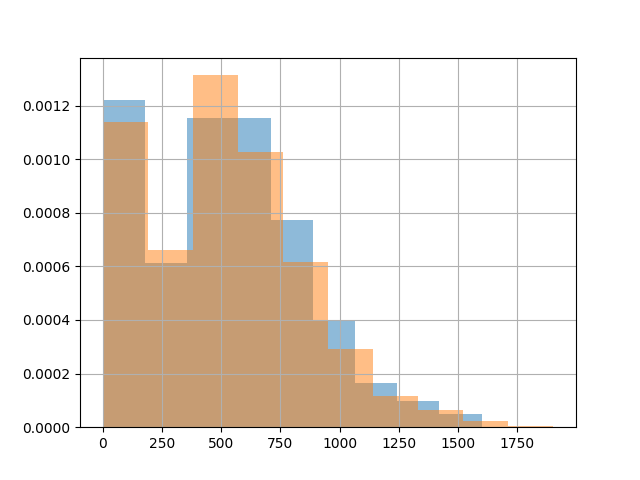
>>> import matplotlib.pyplot as plt
>>> from tests import OPENSEARCH_TEST_CLIENT  # noqa: F401
>>> df = oml.DataFrame(OPENSEARCH_TEST_CLIENT, 'flights')
>>> df[df.OriginWeather == 'Sunny']['FlightTimeMin'].hist(alpha=0.5, density=True)
>>> df[df.OriginWeather != 'Sunny']['FlightTimeMin'].hist(alpha=0.5, density=True)
>>> plt.show()